Sea fishing · Europe's coasts
Findr
Which sea fish are likely feeding on your coast today, and why.
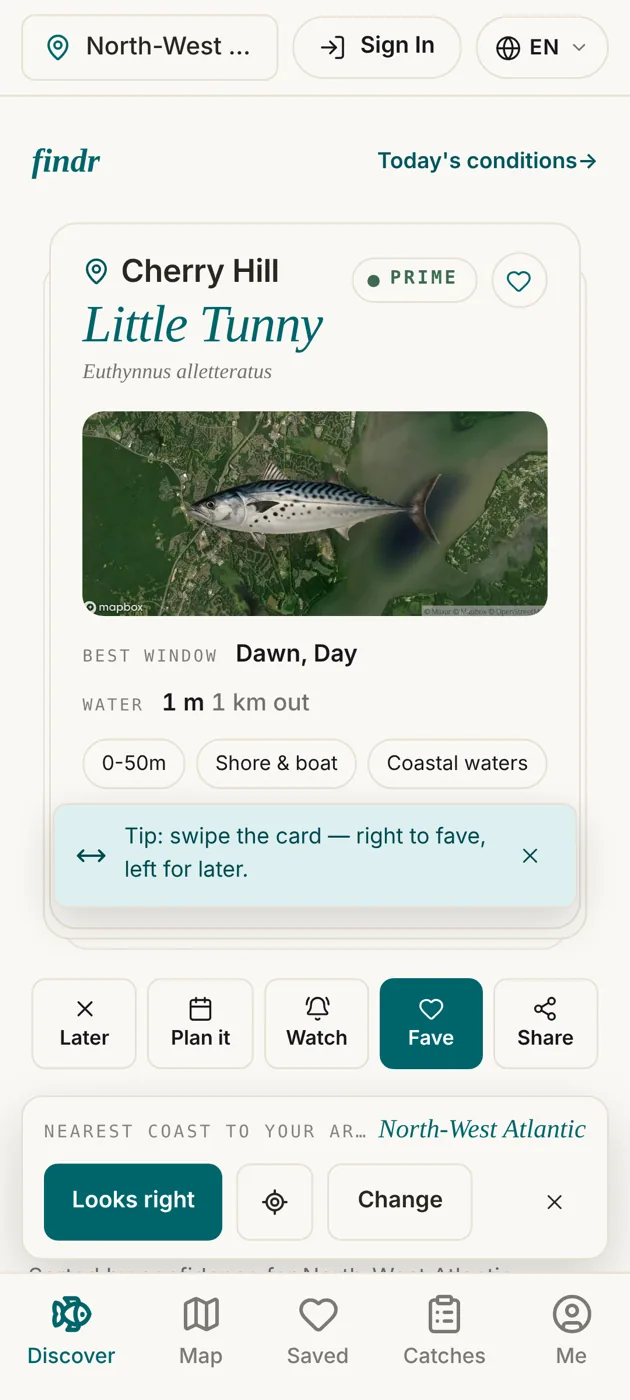
It reads the sea from satellites, weather buoys, live weather feeds, catch reports and shipping reports, and scores each species against it, so shore, boat and lure anglers know what's likely biting before they set off. Web, iPhone and Android.


75
printed fish-ID chart editions for tackle shops
as of 11 November 2026
59
coasts in 9 countries with their own chart
as of 11 November 2026
304
species weighed against the moon and tides
as of 11 November 2026
13
languages in the app
as of 11 November 2026
The problem
A tide table tells you when the water moves. It doesn't tell you whether the bass are in or the mackerel have arrived, and that depends on the sea's temperature, the swell and the moon.
Where it works
Live sea conditions along the coasts people fish
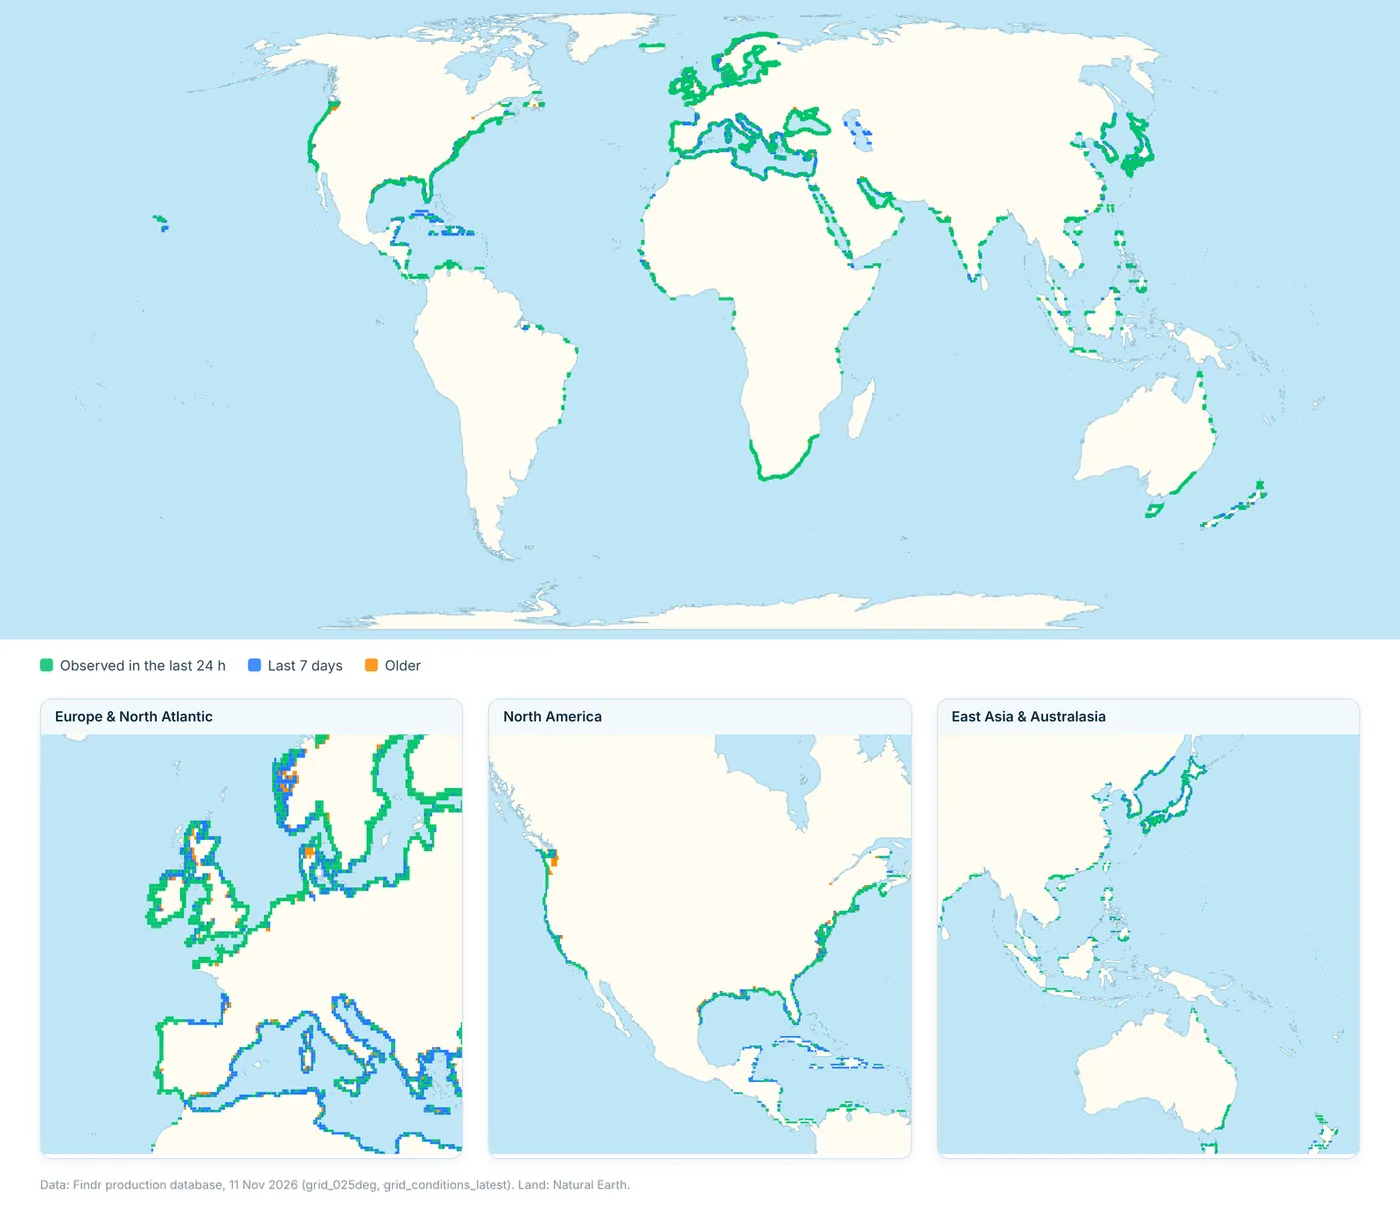
Findr follows the coastal shelf, not the open ocean: 7,649 coastal cells about 28 km across, covering 4.4 million km² of sea. 62% were observed in the last 24 hours and 96% in the last week.
What's clever
Reading the sea for one angler at a time
It reads the sea from space, buoys and boats.
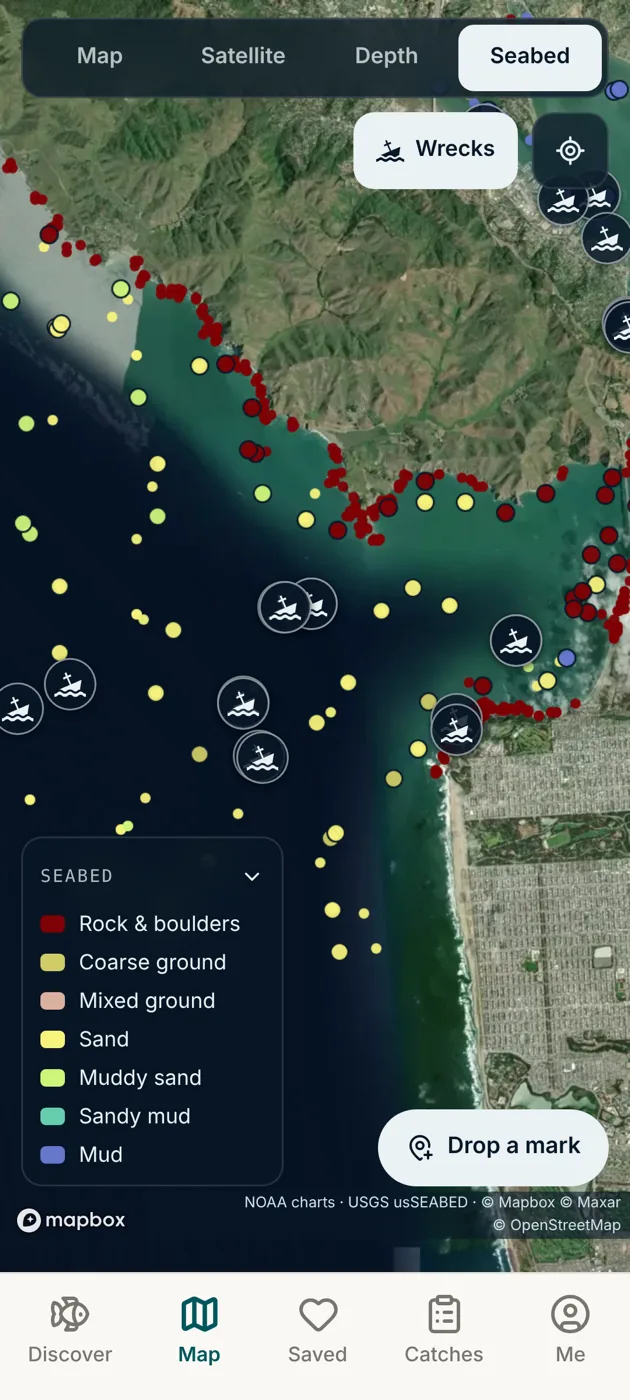
Satellite ocean data from Copernicus, NOAA and ECMWF (temperature fronts, currents and swell) is joined by weather buoys across the oceans, live weather feeds, anglers' catch reports and industrial shipping reports, then scored species by species. In Europe it works on the fisheries grid scientists use; everywhere else, on your exact position.
The moon, done properly.
Moonlight and the spring–neap tide cycle affect fish differently and at different times, so Findr weighs them as two separate effects, for each of 304 species, instead of one blanket "good moon" bonus.
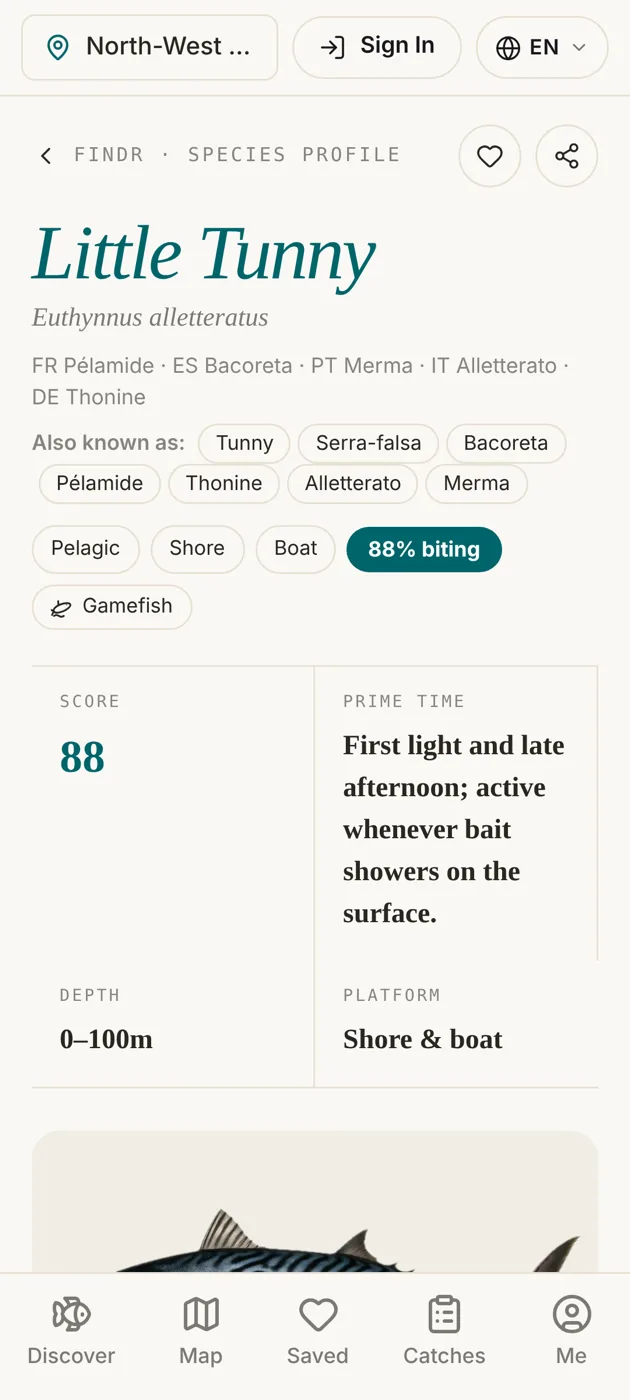
Point the camera at a fish.
Photo identification can run on a premium vision model or an open one at about a fiftieth of the cost per photo, switched without changing the app.
A letter at season's end.
Two weeks before an angler's best months close, an email arrives timed to their own species, with their year in numbers and one question.
Off the screen
A free wall chart for every tackle shop
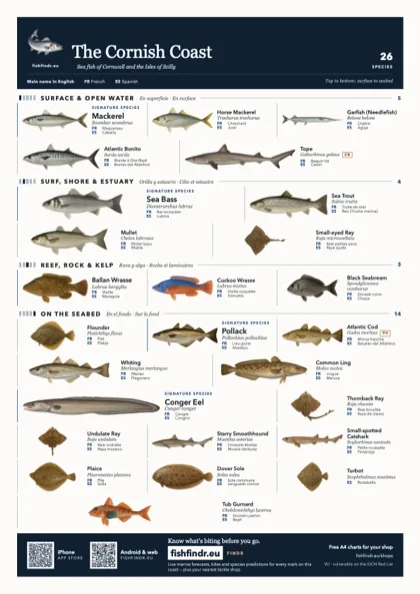
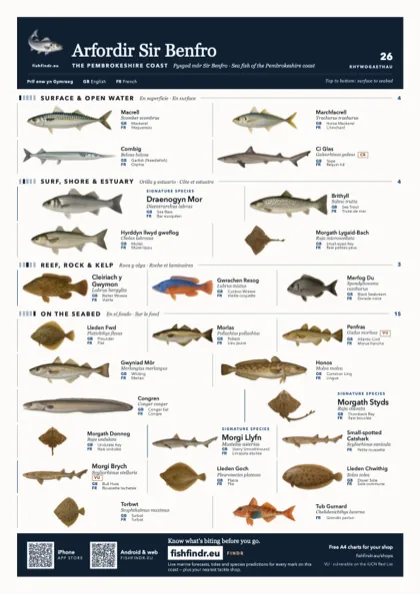
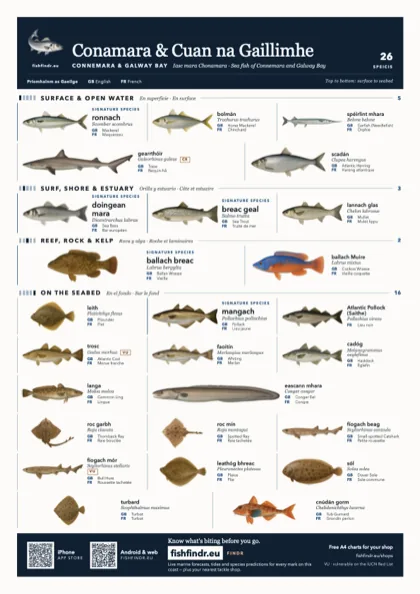
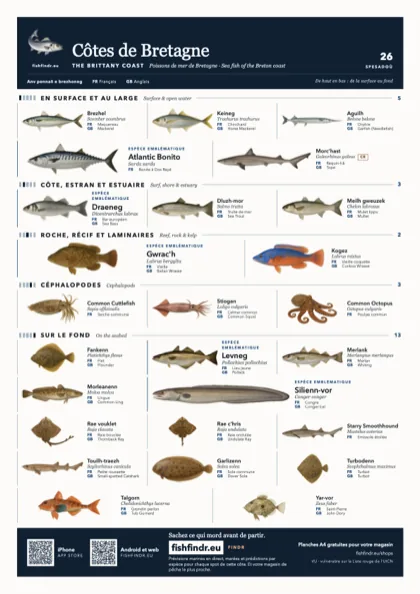
75 printable editions for 59 coasts, in A4 and A3, colour and black and white. The fish are laid out the way they live, from the surface at the top to the seabed at the bottom, and named in the languages spoken on that coast, from Welsh and Irish to Breton and Asturian.
14
chart languages
9
countries
Behind the build
Stack. Next.js, Supabase and Capacitor: one codebase for web, iPhone and Android.
Data. Copernicus marine, NOAA and ECMWF satellites, ocean weather buoys, live weather feeds, catch reports and industrial shipping reports, scored by two prediction engines: one for European waters, one for the rest of the world.
Care. About 460 test files, and 918 species illustrations shared by the app and the charts.
Who uses it
Sea anglers, and the shops that serve them
Shore, boat and lure anglers on Europe's coasts, plus the tackle shops that pin the charts on their walls. Audience figures are in the media kit.
Partner with usExample placement
Sponsor a tackle-shop chart
- Where
- Printed fish-ID wall charts for a coast
- Who sees it
- Sea anglers in that coast's tackle shops
- Price
- Ask for the media kit
Want something like this?
Your data, turned into one plain answer
If your members or customers need public data read for them, on a screen or on a wall, tell us about it.
Build your appNext app
Fly Cast Coach
Your phone becomes a practice fly rod, with an Apple Watch on the other hand.